With record U.S. unemployment levels and federal stimulus money stalling, there are still people spending in this COVID-19 world.
Knowing some of this data can help you market your business in certain states, buy stock, or target industry segments that might use your product or service.
Check out the data we found about where the spenders are in this COVID-19 economy.
U.S. Retail Sales
According to Statista, all retail sales, and those for clothing, furniture, and electronics were down in March and April this year, but were surprisingly up in May and June:
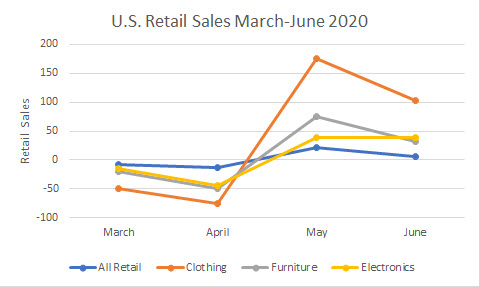
Statista got its numbers from the U.S. Department of Commerce.
Consumer spending by State:
Track the Recovery is a fun and informative tool where you can find and manipulate all different types of data related to COVID-19’s effects on the economy.
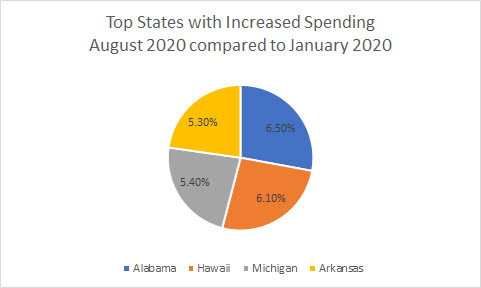
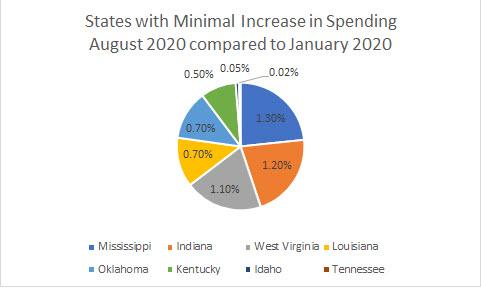
Here are the states that showed an increase in consumer spending in August 2020 compared to January 2020.
The first chart shows the states with the top increase in spending, which include Alabama, Hawaii, Michigan, and Arkansas. The second charge shows states which had a minimal increase in spending compared to the same month.
Best performing Stock sectors during COVID-19
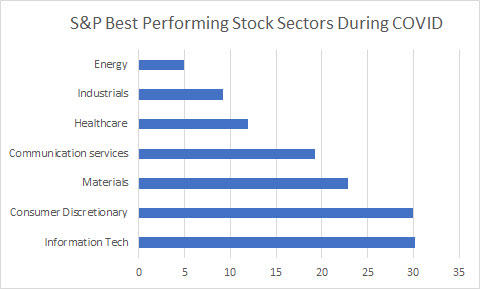
The S&P 500 lists its best-performing stock sectors from March 10 to August 7, 2020. They are Information Tech, Consumer Discretionary, Materials, Communication Services, Healthcare, Industrials, and Energy, respectively.
It would be helpful to dig deeper into each of these sectors to find more details since some stocks within those sectors—such as Consumer Discretionary—are definitely not in the best performing category. From Statista.
Business Profits
There are likely many more business sectors that have shown increases in business profits this year. Here are a few examples, all from Statista.
U.S. Health Insurers
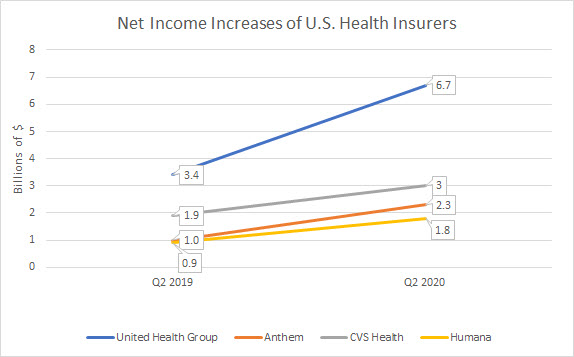
Net income increases from Q2 2019 to Q2 2020 of U.S. health insurers is staggering, with United Health Group, Anthem, CVS Health and Humana leading the way:
Uber Food delivery
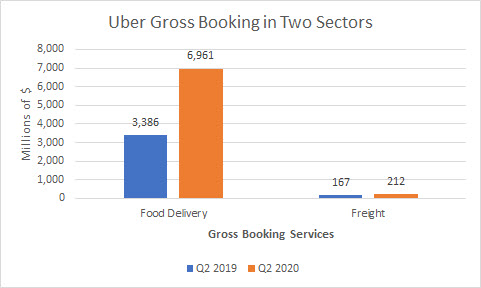
While Uber as a whole lost quite a lot during Q2 2019 and Q3 2019, their gross booking services for food delivery more than doubled, while freight had a slight increase:
Tech Giants
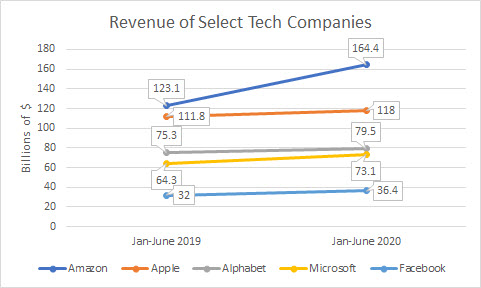
Revenue increases of selected tech companies in the first six months of 2020 vs 2019 is quite impressive too. Amazon saw the largest gains, no surprise. But also in the mix are Apple, Alphabet, Microsoft, and Facebook.
Forecasts
Finally, here are some forecasts for you regarding what the future might look like for consumer market growth sectors and for online sales.
By Consumer Market:
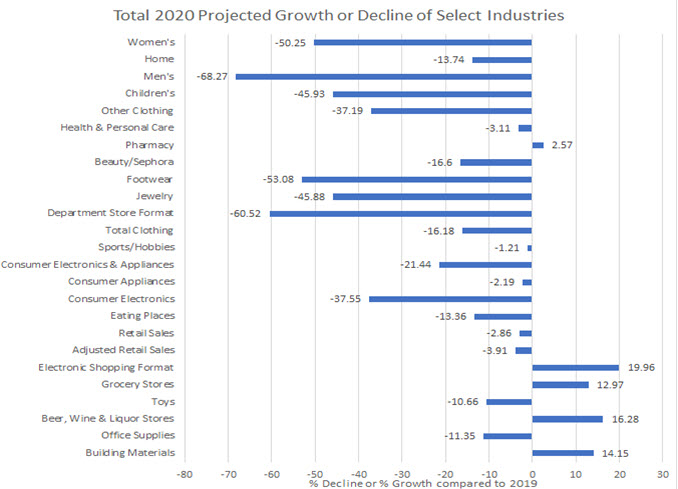
TechCrunch provides data for consumer market segment growth or decline from 2019 to 2020. This is across all sales mediums, not just online sales. Leading the growth pack are:
- Electronic shopping formats
- Beer, wine & liquor stores
- Building materials
- Grocery stores
- Pharmacy
The largest declines are in the areas of mens, department store formats, footwear, children’s, and jewelry, respectively.
Ecommerce Products with the Fastest-Growing Online Sales
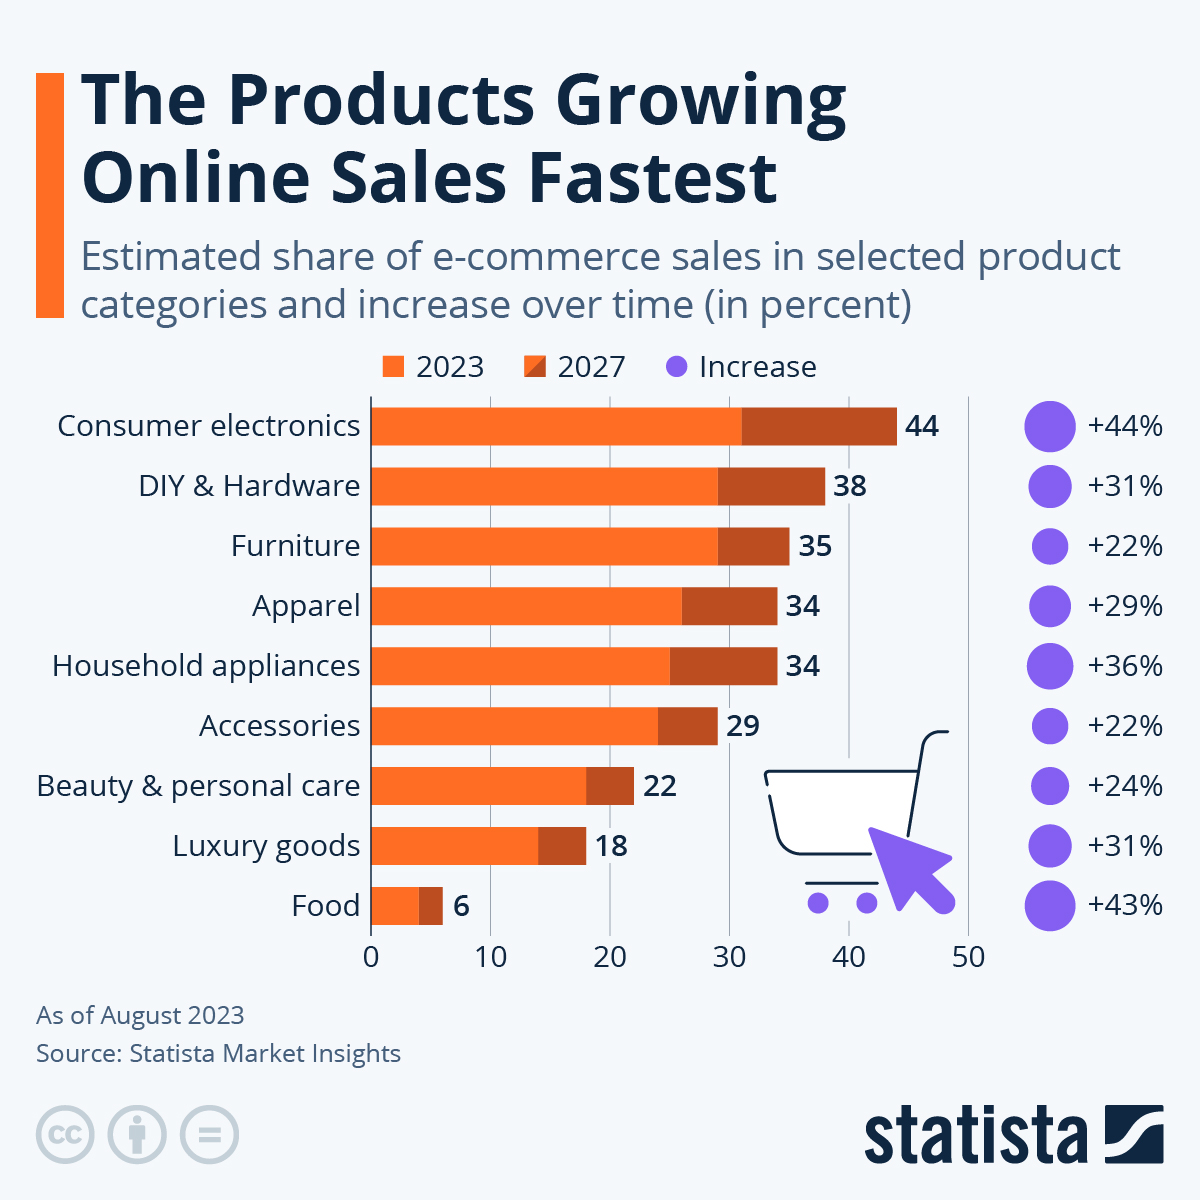
The projected growth of eCommerce products with the fastest-growing online sales from now until 2023 is listed below. Leading the pack in increase by % are: consumer electronics, household appliances, and apparel.
 You will find more infographics at Statista
Hopefully, these numbers will get your mind thinking about ways to market your products or services and make it through this pandemic. We’re all in this together, but some businesses will definitely fare better than others!
About the Author

Bev founded Top Of The List in 2006 and has over 25 years of experience working with technology. In her free time, she competes in dog agility competitions with her Golden Retrievers, Cosmo, and Finn.


